✓Model correct — prediction AZ Alkmaar
Peer Koopmeiners
(ast. Valdemar Byskov Andreasen)
49'
Mexx Meerdink
77'
(pen.)
55'
(ast. zahi ahmed)
Forson Amankwah
The ForzaPitch pre-match prediction gave AZ Alkmaar a 60% win probability (draw 18%, Hapoel Beer Sheva 21%). The final result was AZ Alkmaar 2–1 Hapoel Beer Sheva.
Match statistics
15
Total shots
6
7
Shots on target
4
2.65
Actual xG
1.07
3
Saves
5
58%
Possession
42%
5
Corners
1
25
Tackles
20
4
🟨 Yellow cards
4
Match Events
39'
Pedro Miguel Santos Amador
Seiya Maikuma
45'
⚽Peer Koopmeiners
· ast. Valdemar Byskov Andreasen
49'
52'
Eilel Peretz
Ayoub Oufkir
52'
53'
Miguel Vitor
/
Idan Nachmias
55'
ast. zahi ahmed ·
Forson Amankwah⚽
Seiya Maikuma
/ Denso Kasius
61'
Ayoub Oufkir
/ Calvin Stengs
61'
62'
Javon East
/
Mohamad Abu Rumi
62'
Niv·Yehoshua
/
Eilel Peretz
75'
76'
Djibril diop
Bendegúz Kovács
/ Mexx Meerdink
76'
Mees de Wit
/ Mateo Chávez
76'
⚽Mexx Meerdink
(pen.)
77'
78'
João Victor
/
zahi ahmed
78'
Adrián Ugarriza
/
Igor Zlatanović
Calvin Stengs
78'
Denso Kasius
83'
Ro Zangelo Daal
/ Weslley Pinto Batista
86'
90'+1
Adrián Ugarriza
Pre-match prediction
60.52%
AZ ←
18.28%
X
21.2%
Hapoel
✓ Correct prediction —
we assigned to the actual result (AZ Alkmaar)
60.52%
(high confidence)
Expected vs actual xG
Exp.
Actual
Δ
3.37
2.65
-0.72
1.94
1.07
-0.87
AZ Alkmaar dominated by xG (2.65 vs 1.07).
The final result reflects the playing dominance.
The model's xG estimates diverged from reality.


































Lineups
28
 J. De Busser
G
J. De Busser
G
34
 M. de Wit
76'
D
M. de Wit
76'
D
29
 W. Hoedt
D
W. Hoedt
D
3
 W. Goes
D
W. Goes
D
2
 S. Maikuma
61'
D
S. Maikuma
61'
D
6
 P. Koopmeiners
1 ⚽
M
P. Koopmeiners
1 ⚽
M
21
 D. Kwakman
M
D. Kwakman
M
11
 R. Daal
86'
M
R. Daal
86'
M
17
 V. Byskov
1 👟
M
V. Byskov
1 👟
M
24
 A. Oufkir
61'
M
A. Oufkir
61'
M
18
 B. Kovacs
76'
F
B. Kovacs
76'
F
Bench
14
 C. Stengs
29'
M
C. Stengs
29'
M
30
 D. Kasius
29'
D
D. Kasius
29'
D
22
 E. Dijkstra
D
E. Dijkstra
D
8
 J. Clasie
M
J. Clasie
M
4
 L. Schouten
D
L. Schouten
D
5
 M. Chávez
14'
D
M. Chávez
14'
D
9
 M. Meerdink
1 ⚽
14'
F
M. Meerdink
1 ⚽
14'
F
31
 R. Ichihara
D
R. Ichihara
D
1
 R. Owusu-Oduro
G
R. Owusu-Oduro
G
7
 Weslley Patati
4'
F
Weslley Patati
4'
F
1
 O. Marciano
G
O. Marciano
G
5
 Pedro Amador
D
Pedro Amador
D
15
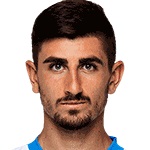 I. Nachmias
53'
D
I. Nachmias
53'
D
44
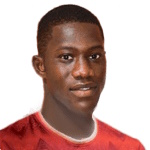 D. Diop
D
D. Diop
D
2
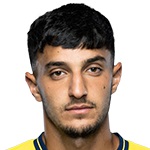 G. Mizrahi
D
G. Mizrahi
D
7
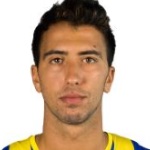 E. Peretz
62'
M
E. Peretz
62'
M
25
 Lucas Ventura
M
Lucas Ventura
M
17
 A. Forson
1 ⚽
M
A. Forson
1 ⚽
M
9
 Z. Ahmed
1 👟
78'
F
Z. Ahmed
1 👟
78'
F
66
 I. Zlatanović
78'
F
I. Zlatanović
78'
F
45
 M. Abu Rumi
62'
F
M. Abu Rumi
62'
F
Bench
11
 A. Ganah
F
A. Ganah
F
90
 A. Ugarriza
12'
F
A. Ugarriza
12'
F
12
 I. Rotman
D
I. Rotman
D
20
 J. East
28'
F
J. East
28'
F
70
 João Victor
12'
F
João Victor
12'
F
8
 M. Kna'an
F
M. Kna'an
F
4
 M. Vítor
37'
D
M. Vítor
37'
D
34
 M. Wolff
G
M. Wolff
G
28
 N. Yehoshua
28'
M
N. Yehoshua
28'
M
13
 O. Davidzada
D
O. Davidzada
D
36
 Y. Shani
G
Y. Shani
G
Best on the pitch
P. Koopmeiners
M · AZ
8.20
1 ⚽
1 shots
· 75 pass
M. Meerdink
F · AZ
7.80
1 ⚽
2 shots
· 6 pass
V. Byskov
M · AZ
7.70
1 👟
2 shots
· 48 pass
A. Forson
M · Hapoel
7.50
1 ⚽
2 shots
· 28 pass
D. Kwakman
M · AZ
7.00
2 shots
· 67 pass
W. Goes
D · AZ
6.98
1 shots
· 81 pass
 AZ Alkmaar — Player statistics
| Team | Pos | Min | Rating | ⚽ | 👟 | Shots | Pass | Acc% | Tck | YC | RC |
|---|---|---|---|---|---|---|---|---|---|---|---|
| J. De Busser | G | 90 | 6.82 | — | — | 0 | 44 | 30% | 0 | — | — |
| M. de Wit | D | 76 | 6.83 | — | — | 0 | 55 | 50% | 3 | — | — |
| W. Hoedt | D | 90 | 6.49 | — | — | 1 | 78 | 64% | 1 | — | — |
| W. Goes | D | 90 | 6.98 | — | — | 1 | 81 | 69% | 4 | — | — |
| S. Maikuma | D | 61 | 6.65 | — | — | 0 | 33 | 29% | 5 | 1 | — |
| P. Koopmeiners | M | 90 | 8.20 | 1 | — | 1 | 75 | 71% | 3 | — | — |
| D. Kwakman | M | 90 | 7.00 | — | — | 2 | 67 | 59% | 1 | — | — |
| R. Daal | M | 86 | 6.86 | — | — | 1 | 35 | 29% | 1 | — | — |
| V. Byskov | M | 90 | 7.70 | — | 1 | 2 | 48 | 41% | 3 | — | — |
| A. Oufkir | M | 61 | 6.05 | — | — | 2 | 22 | 15% | 2 | 1 | — |
| B. Kovacs | F | 76 | 6.26 | — | — | 2 | 13 | 12% | 1 | — | — |
| C. Stengs | M | 29 | 5.88 | — | — | 1 | 11 | 10% | 0 | 1 | — |
| D. Kasius | D | 29 | 6.07 | — | — | 0 | 15 | 12% | 0 | 1 | — |
| M. Chávez | D | 14 | 6.55 | — | — | 0 | 5 | 4% | 0 | — | — |
| M. Meerdink | F | 14 | 7.80 | 1 | — | 2 | 6 | 4% | 1 | — | — |
| Weslley Patati | F | 4 | 6.56 | — | — | 0 | 1 | 0% | 0 | — | — |
 Hapoel Beer Sheva — Player statistics
| Team | Pos | Min | Rating | ⚽ | 👟 | Shots | Pass | Acc% | Tck | YC | RC |
|---|---|---|---|---|---|---|---|---|---|---|---|
| O. Marciano | G | 90 | 6.68 | — | — | 0 | 42 | 30% | 0 | — | — |
| Pedro Amador | D | 90 | 5.48 | — | — | 0 | 50 | 34% | 2 | 1 | — |
| I. Nachmias | D | 53 | 6.25 | — | — | 0 | 37 | 29% | 1 | — | — |
| D. Diop | D | 90 | 5.67 | — | — | 0 | 53 | 44% | 0 | 1 | — |
| G. Mizrahi | D | 90 | 5.99 | — | — | 0 | 39 | 26% | 0 | — | — |
| E. Peretz | M | 62 | 5.52 | — | — | 0 | 29 | 20% | 2 | 1 | — |
| Lucas Ventura | M | 90 | 6.47 | — | — | 0 | 39 | 37% | 4 | — | — |
| A. Forson | M | 90 | 7.50 | 1 | — | 2 | 28 | 22% | 1 | — | — |
| Z. Ahmed | F | 78 | 6.81 | — | 1 | 1 | 12 | 8% | 2 | — | — |
| I. Zlatanović | F | 78 | 6.42 | — | — | 0 | 16 | 13% | 0 | — | — |
| M. Abu Rumi | F | 62 | 6.41 | — | — | 0 | 10 | 6% | 4 | — | — |
| A. Ugarriza | F | 12 | 6.07 | — | — | 0 | 7 | 6% | 0 | 1 | — |
| J. East | F | 28 | 6.48 | — | — | 2 | 7 | 6% | 0 | — | — |
| João Victor | F | 12 | 6.20 | — | — | 0 | 5 | 4% | 0 | — | — |
| M. Vítor | D | 37 | 6.95 | — | — | 1 | 25 | 22% | 3 | — | — |
| N. Yehoshua | M | 28 | 6.34 | — | — | 0 | 9 | 8% | 1 | — | — |
Frequently Asked Questions
What was the final score of AZ Alkmaar vs Hapoel Beer Sheva?
The final score was AZ Alkmaar 2–1 Hapoel Beer Sheva.
What did the model predict before AZ Alkmaar vs Hapoel Beer Sheva?
The model assigned 60% probability to a AZ Alkmaar win, 18% to a draw, and 21% to an Hapoel Beer Sheva win.